CLR events: go for the nettrace file format!
As shown in the previous post, the processing of ProcessInfo diagnostic commands is easy because you send a request and read the different fields from the response. This is different if you want to receive events from the CLR via EventPipe. In C#, the TraceEvent nuget package wraps everything under a nice event handler based model as shown in many of my previous posts.
Behind the scene, a StartSession command is sent (more details about the parameters later) and the response contains the numeric ID of the session. Then, the events will be read from the IPC channel as a binary stream of data with the “nettrace“ file format. The collection ends when the StopTracing command is sent.
The source code is available from my github repository.
Hidding the transport layer: IIpcEndoint
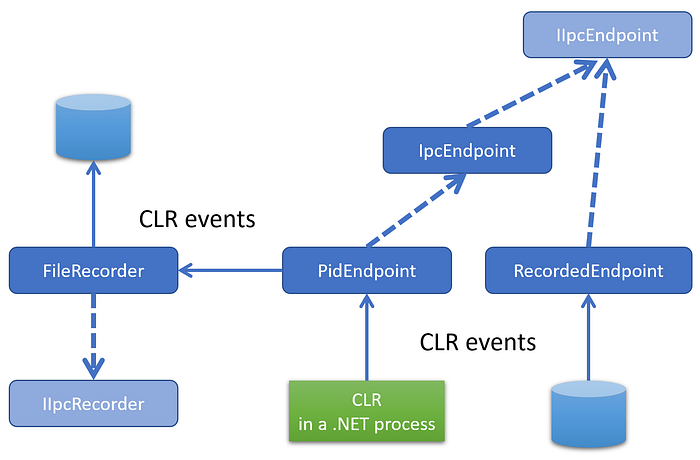
Unlike the previous post, to send the command and read the response back from the CLR , I’m wrapping the transport layer with the IIpcEndpoint interface:
It abstracts the write and read accesses to the underlying transport layer. In addition, the base class accepts a “recorder” that allows me to store what is received from the CLR into any kind of storage (today only a file-based recorder that helped a lot to reproduce specific situations without the need to have a running process to connect to):

The PidEndpoint class accepts the process id of the running .NET application to monitor its CLR events and an optional recorder implementing the IIpcRecorder interface. The Create static factory implementation creates the expected named pipe on Windows (or the domain socket on Linux) and stores the handle into its _handle field:
The next step is to open a tracing session by sending the StartSession command.
The Trace diagnostic commands
Following the same object model provided by the Microsoft.Diagnostics.NETCore.Client nuget, my DiagnosticsClient class hides the transport layer. It also exposes high level functions such as OpenEventPipeSession to initiate a trace event session with the CLR:
If you remember from TraceEvent, you need a few parameters to create a session:
- size of circular buffers used by the CLR to cache events (same as Perfview, use 16 MB as default)
- netttrace format (i.e. value of 1)
- if rundown events are needed
- a list of providers (“Microsoft-Windows-DotNETRuntime” for the CLR in my case)
- keywords
- verbosity level
- possible arguments (none here)
Here is the corresponding C++ description of the command type:
The code to fill up the command is straightforward:
The provider list is defined with the ProviderCount field and string containing the list (only one here) follows the Verbosity field. To start the session, it is needed to send the StartSession message and read the session id from the response:
Once the StartSession command has been sent, the events corresponding to the given provider/keywords/verbosity (here the CLR runtime/gc+exception+contention/verbose)
will be read from the event pipe. Since this action will be synchronous, it is recommended to dedicate a thread to read and process the events:
The ListenToEvents callback executed by the new thread is “simply” listening to the event pipe of the session:
Before describing how to read the events, it is important to understand how to stop the flow. First, inside the EventPipeSession, the internal loop that reads events needs to exit thanks to the _stopRequested boolean:
In addition, a message with StopTracing command id from the EventPipe command set needs to be sent to tell the CLR to stop sending the events. This message must be sent through a different IPC channel (hence the pStopClient variable used in the previous code. The StopEventPipeSession helper function uses the EventPipeStopRequest wrapper:
The StopSession command accepts the session ID as single parameter:
The processing of the stop request is to create such a message and send it through the IPC channel:
When the stop command is received by the CLR, the remaining “data” (more on this in the next episode) is sent through the first IPC channel before being closed. This is how the code knows that the session can stop listening to the EventPipe.
The next episode will start to parse the nettrace stream of events.
Resources
- Episode 1 — Digging into the CLR Diagnostics IPC Protocol in C#
- Episode 2 — .NET Diagnostic IPC protocol: the C++ way
- Source code for the C++ implementation of CLR events listener
- Diagnostics IPC protocol documentation
- Microsoft.Diagnostics.NETCore.Client source code
