Christophe NasarreTrigger your GCs with dotnet-fullgc!This post explains how I wrote a CLI tool that triggers a GC in any .NET applicationMay 221May 221
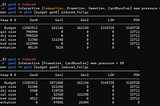
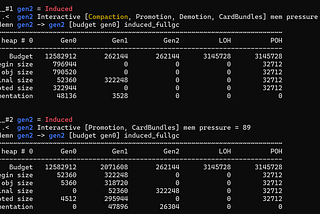
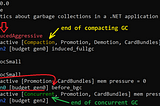
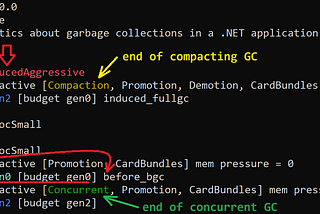
Christophe NasarreView your GCs statistics live with dotnet-gcstats!Discover how to look at the .NET GC statistics to better understand your garbage collectionsMar 1Mar 1
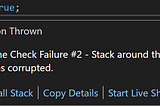
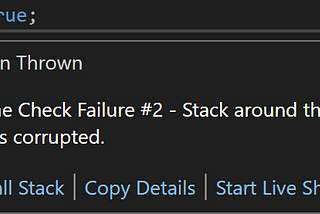
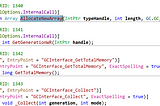
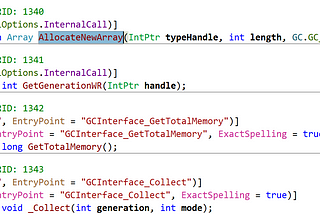
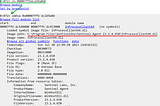
Christophe NasarreBe Aligned! Or how to investigate a stack corruptionThis post describes the different steps I followed to investigate a stack corruption with Visual StudioDec 11, 2023Dec 11, 2023
Christophe NasarreHow to dig into the CLRThe goal of this post is to share the tips and tricks I used to navigate into the CLR implementation to better understand how .NET worksNov 12, 20231Nov 12, 20231
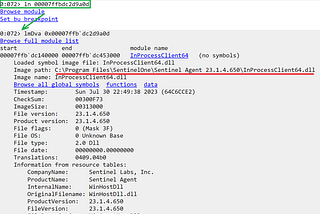
Christophe NasarreCrap: the application is randomly crashing!This post is listing which steps were followed to investigate a customer random crash issue I faced last week.Oct 2, 20231Oct 2, 20231
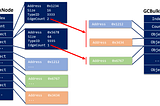
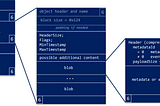
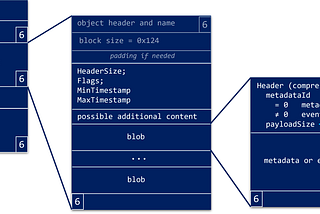
Christophe Nasarre.NET .gcdump InternalsLearn what the .NET CLR does behind the scene to help the tools to generate a .gcdump!Aug 11, 20232Aug 11, 20232
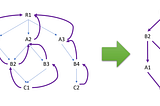
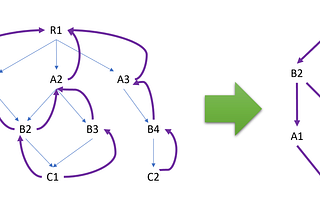
Christophe NasarreRaiders of the lost root: looking for memory leaks in .NETThis post explains how you could write your own memory profiler based on new .NET 7.0 profiler APIs in C++May 8, 2023May 8, 2023
Christophe NasarreFrom Metadata to Event block in nettrace formatThe previous episodes started the parsing of the “nettrace” format. This last episode covers Metadata and Event blocks format.Mar 10, 2023Mar 10, 2023
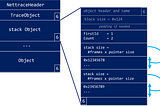
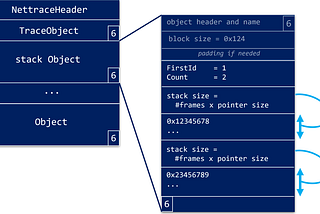
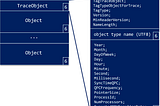
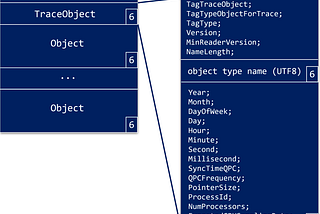
Christophe NasarreReading “object” in memory - starting with stacksDuring the parsing of the nettrace format, blocks are serialized as “object”. Let’s look at “stack” objects.Jan 15, 2023Jan 15, 2023
Christophe NasarreParsing the “nettrace” stream of (not only) eventsThe previous episodes explained how to initiate the protocol to receive CLR events. It is now time to dig into the “nettrace” stream…Nov 27, 2022Nov 27, 2022